| Source: Sulekha Plan Monitoring System |
|
|
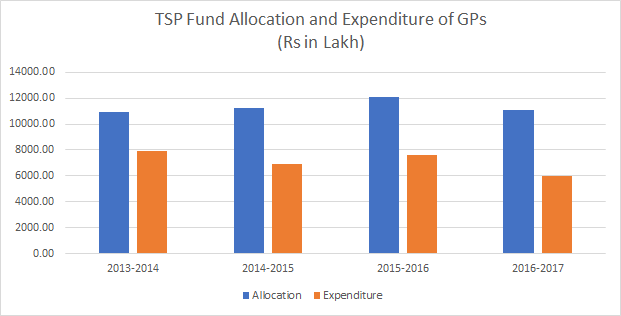
| Year |
Total Allocation (Rs in Lakhs) |
Total Expenditure(Rs in Lakhs |
| 2013-2014 |
10944.07 |
7914.75 |
| 2014-2015 |
11266.50 |
6916.95 |
| 2015-2016 |
12091.54 |
7622.10 |
| 2016-2017 |
11081.35 |
6016.32 |
|
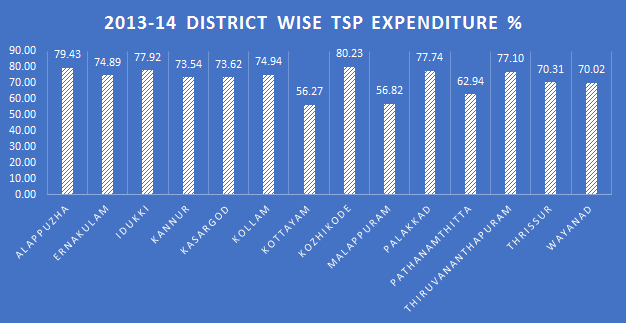 |
| 2013-14 |
| District |
Expenditure% |
| Alappuzha |
79.43 |
| Ernakulam |
74.89 |
| Idukki |
77.92 |
| Kannur |
73.54 |
| Kasargod |
73.62 |
| Kollam |
74.94 |
| Kottayam |
56.27 |
| Kozhikode |
80.23 |
| Malappuram |
56.82 |
| Palakkad |
77.74 |
| Pathanamthitta |
62.94 |
| Thiruvananthapuram |
77.10 |
| Thrissur |
70.31 |
| Wayanad |
70.02 |
|
| |
|
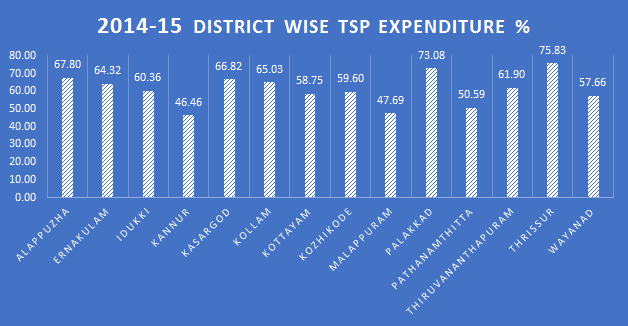 |
| 2014-2015 |
| District |
Expenditure% |
| Alappuzha |
67.80 |
| Ernakulam |
64.32 |
| Idukki |
60.36 |
| Kannur |
46.46 |
| Kasargod |
66.82 |
| Kollam |
65.03 |
| Kottayam |
58.75 |
| Kozhikode |
59.60 |
| Malappuram |
47.69 |
| Palakkad |
73.08 |
| Pathanamthitta |
50.59 |
| Thiruvananthapuram |
61.90 |
| Thrissur |
75.83 |
| Wayanad |
57.66 |
|
| |
|
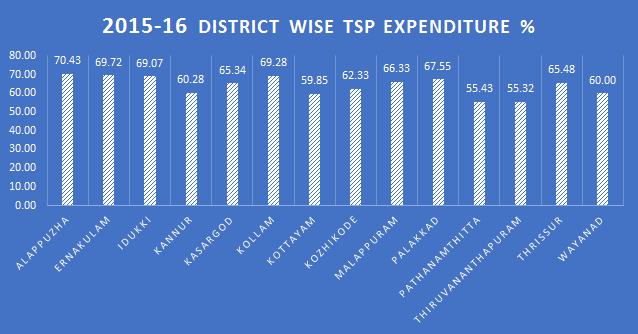 |
| 2015-16 |
| District |
Expenditure% |
| Alappuzha |
70.43 |
| Ernakulam |
69.72 |
| Idukki |
69.07 |
| Kannur |
60.28 |
| Kasargod |
65.34 |
| Kollam |
69.28 |
| Kottayam |
59.85 |
| Kozhikode |
62.33 |
| Malappuram |
66.33 |
| Palakkad |
67.55 |
| Pathanamthitta |
55.43 |
| Thiruvananthapuram |
55.32 |
| Thrissur |
65.48 |
| Wayanad |
60.00 |
|
| |
|
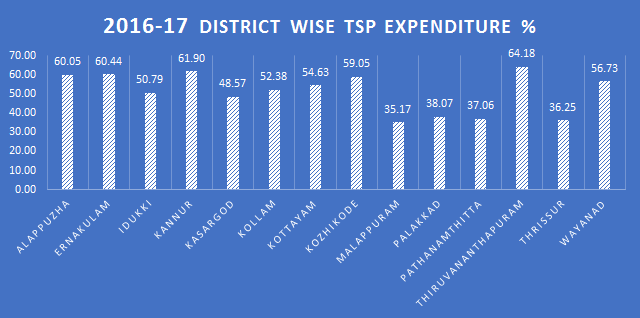 |
| 2016-2017 |
| District |
Expenditure% |
| Alappuzha |
60.05 |
| Ernakulam |
60.44 |
| Idukki |
50.79 |
| Kannur |
61.90 |
| Kasargod |
48.57 |
| Kollam |
52.38 |
| Kottayam |
54.63 |
| Kozhikode |
59.05 |
| Malappuram |
35.17 |
| Palakkad |
38.07 |
| Pathanamthitta |
37.06 |
| Thiruvananthapuram |
64.18 |
| Thrissur |
36.25 |
| Wayanad |
56.73 |
|
| |
|